When your data is a cluster…
Every statistical procedure brings with it some assumptions or conditions for the results to be valid. When those assumptions aren’t met, you can draw the wrong conclusions from your data.
One common assumption is that observations are independent of one another. Imagine flipping a coin. Every coin flip is independent of the last one…the last flip doesn’t influence how it will turn out the next time.
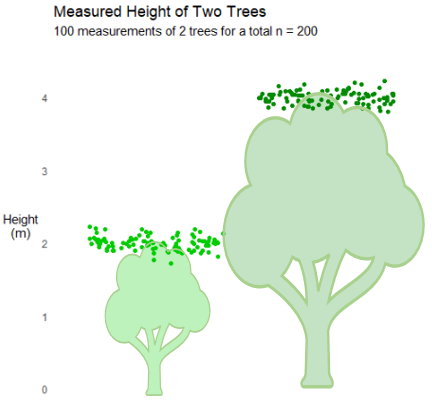
But oftentimes, data is correlated, or clustered. Suppose we want to know the average height of the trees in a park. There are too many trees to measure them all, so we are using data from just a sample.
If I tell you the average height is 3 meters and that we took n = 200 measurements, you might be pretty convinced that 3 meters accurately represents the true average height. After all, we took 200 measurements. But there’s a slight detail I forgot to mention, we only measured two trees because our surveyor was lazy, and just measured each tree 100 times.
You’d have much less confidence in this estimate now, right? Let’s walk through a simulation to show what happens when we don’t properly account for this clustering of data. We will generate a bunch of data and then run linear regression to find the coefficient estimate. Imagine we’re evaluating the a tutoring program on test scores. The true value of the intervention is 0…but is that what we find?
First, let’s just look at some uncorrelated data to see what should happen. (And maybe take a look at my post on p-values).
Fig 1: Confidence Intervals for a linear regression; true value is 0When the data is uncorrelated, the confidence interval almost always “captures” the true value of the coefficient (which is 0 in this case).
Now suppose the data is clustered. The individuals are related in some way, grouped into 50 clusters…we have 20 students in 50 classes for a total of 1000 students. What happens now?
Suddenly our confidence interval isn’t capturing the true value nearly as often. 41% of the time we say that there is a “statistically significant” result when in actuality, there’s no effect at all. Surely there’s a way to fix it?
Enter robust standard errors, or Eickhart-Huber-White standard errors. For technical details, the Wikipedia page has a great write-up. The good news is that we don’t usually need to know the math and our software can do it for us.
Look at that! We’re back where we need to be, usually drawing the right conclusion.
But we can’t just rely on our software to do magic for us. We have to make decisions about the right level to cluster our standard errors. What if in addition to students in classes, they took a test twice (after 3 and 6 months of tutoring)? Now we have 500 students, in 50 classes, who each take a test twice (still n=1000 observations).
Clustering at the lowest level, the student, Robust SEs still work great.
What if we clustered at the next higher level (at the class instead of individual level). So we still have 500 students, in 50 classes, who each take a test twice (n=1000 observations).
We don’t do quite as well. The Type 1 error rate is 8.6%…a bit higher than the 5% we’d like to see.
What if we tell our software to cluster at both the individual AND the class level? We actually get the same result. Why? Because an individual is always in the same class (in our example) so that gets lost. Robust standard errors “stack” everything so the individual-level correlation gets lost. We still have the same error rate.
Robust standard errors aren’t magical. In our example, students took the test twice but there was no correlation between the time points (they wouldn’t necessarily do better or worse on the first versus second test). But what if we tell our software to cluster on Time instead of on the individual or cluster/class?
We’d get a 36.5% Type 1 error rate…a large percent of the time we would conclude there was a statistically significant effect when there isn’t one.
Now, none of these models actually “adjusted” for the individual (e.g., some students are better test-takers) or class (e.g., some teachers are better) effects. For that, a mixed-model is probably safest.


