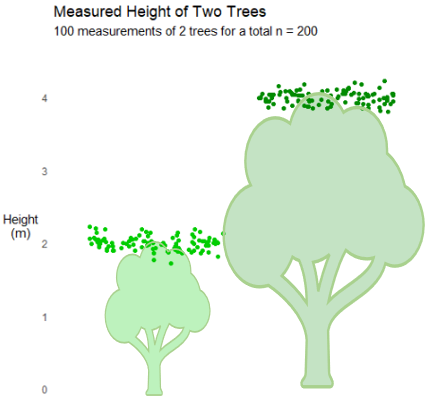
When your data is a cluster…
Would you estimate the average height of all the trees in a park by measuring two trees 100 times? It’s an extreme example, but similar a phenomenon exists in lots of data analysis. Let’s look at Robust Standard Errors…and what happens if you don’t use them!

The thing about p-values…
How should you feel about p-values? Is p=0.0499 that different from p=0.0501? This simulation attempts to get at some of the intuition behind p-values.

Radar Plots Can Be Misleading
Why are radar or spider charts often misleading?